
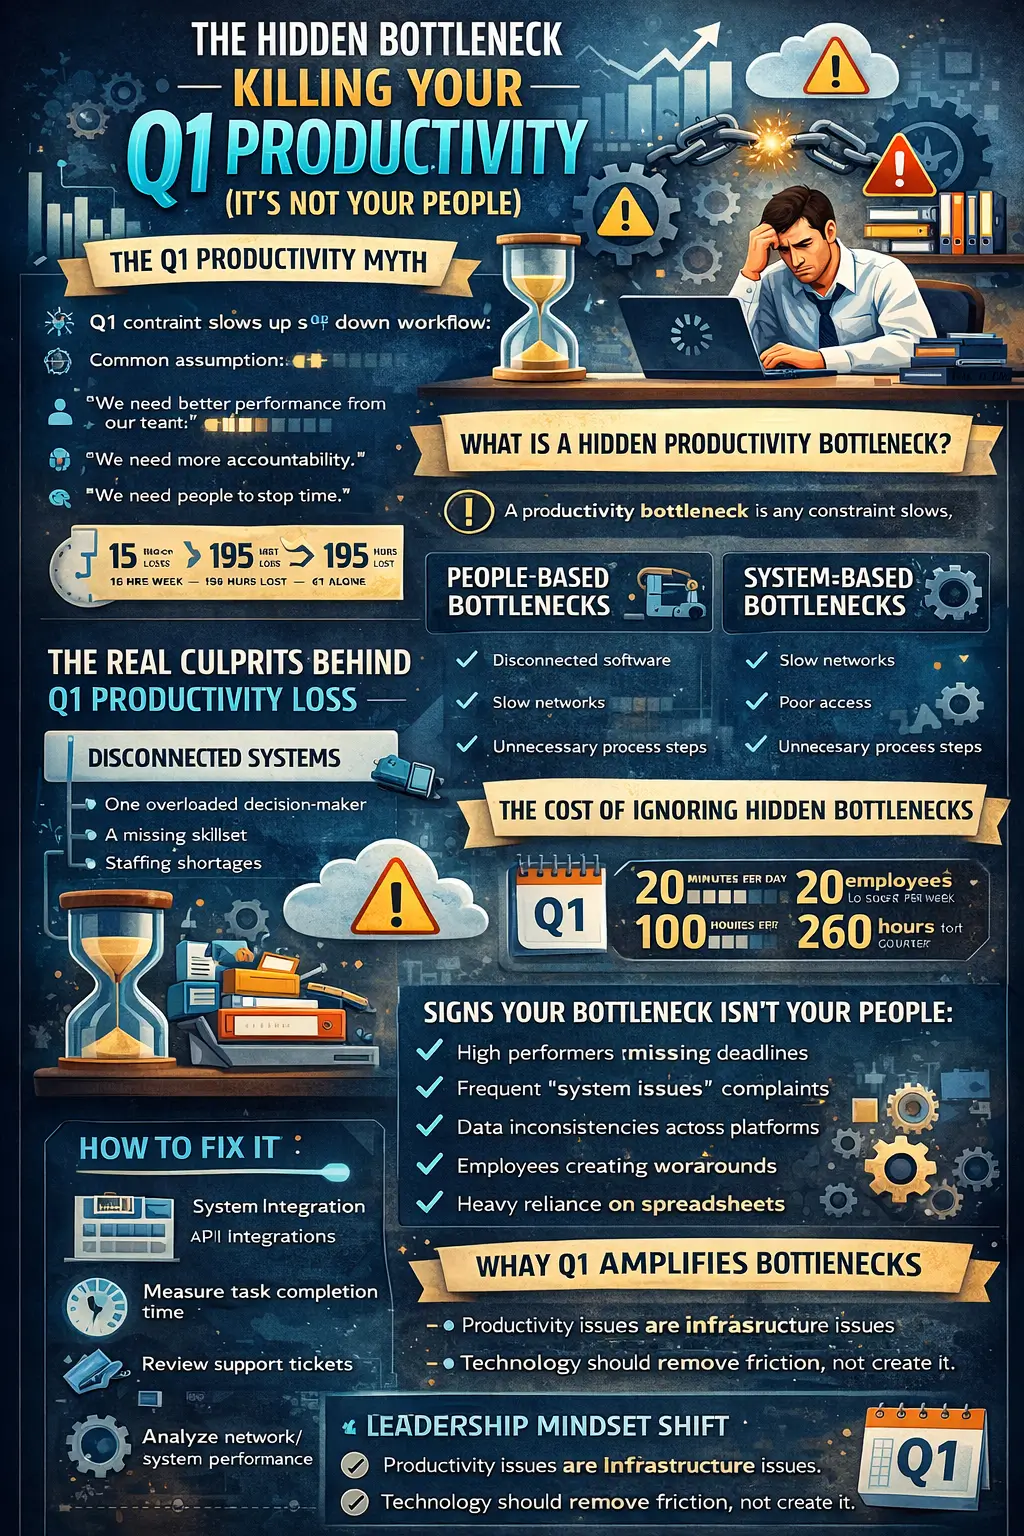
The Hidden Bottleneck Killing Your Q1 Productivity (It’s Not Your People)
By mid-February, many business owners across Raleigh, Cary, and Durham begin asking the same uneasy question:
“Why does it feel like we’re working harder than ever—but moving slower?”
The first instinct is often to look at performance. Are employees distracted? Are managers failing to enforce accountability? Is morale slipping?
In most cases, the answer is far less dramatic—and far more fixable.
The real culprit behind many Q1 productivity issues isn’t your team. It’s the hidden bottleneck in productivity quietly embedded within your systems, workflows, and technology infrastructure.
And because these operational bottlenecks are not people-related, they often go unnoticed until the quarter is already off track.
Let’s unpack what’s really happening.
The Q1 Productivity Myth
Why Q1 Is Critical for Annual Momentum
Q1 sets the pace for the entire year. Strategic initiatives launch. Budgets are activated. Sales targets reset. Hiring plans begin. For many North Carolina businesses, especially growing firms in the Research Triangle, Q1 determines whether annual projections remain realistic—or optimistic.
When execution slows in Q1, pressure builds quickly.
Leadership meetings become more urgent. Reporting becomes more frequent. Teams are told to “tighten up.”
But here’s the uncomfortable truth:
Productivity rarely stalls in Q1 because people suddenly forgot how to perform.
It stalls because business productivity friction accumulates.
The Common Assumption: “We Need Better Performance.”
It is natural to assume productivity drag factors stem from:
- Lack of urgency
- Skill gaps
- Poor communication
- Weak management
Yet many high-performing teams are slowed by efficiency barriers in Q1 that have nothing to do with effort.
A Simple Example
If 15 employees each lose just 12 minutes per day waiting on slow systems, re-entering data, or chasing approvals:
12 minutes × 5 days = 60 minutes per week
1 hour × 13 weeks (a quarter) = 13 hours per employee
13 hours × 15 employees = 195 hours lost in Q1 alone
That’s nearly five full workweeks of productivity—vanished.
This is how tech friction slowing productivity quietly derails momentum.
What Is a Hidden Productivity Bottleneck?
A productivity bottleneck is any constraint that limits workflow speed or output.
In business terms, bottlenecks appear as:
- Delays between steps
- Excessive approvals
- Repetitive data entry
- Misaligned tools
- Waiting on access
People-Based vs. System-Based Bottlenecks
People-Based Bottlenecks
- One overwhelmed decision-maker
- A missing skillset
- Staffing shortages
System-Based Bottlenecks
- Disconnected business software
- Network drag productivity issues
- Manual processes where automation should exist
- Tool integration problems
- Poor access governance
Hidden bottlenecks are difficult to detect because they masquerade as “normal.” Over time, workflow inefficiencies become cultural habits.
And that’s when business process friction compounds.
The Real Culprits Behind Q1 Productivity Loss
- Disconnected Systems
One of the most common tech bottlenecks in business is systems not communicating.
Examples:
- CRM not syncing with accounting software
- Marketing automation disconnected from sales data
- Project management tools isolated from billing
When platforms don’t integrate, humans compensate.
Manual data entry issues multiply. Errors increase. Reporting becomes inconsistent.
What appears to be performance inconsistency is often simply duplicated effort.
- Slow or Outdated Technology
You may not notice a 10-second delay. But your employees do—multiple times per hour.
Common culprits:
- Aging hardware
- Poor Wi-Fi coverage
- Network congestion
- Cloud misconfigurations
- Outdated security layers slowing processing
This subtle system overhead slowing output becomes normalized.
But in Q1—when activity spikes—those delays magnify.
- Approval & Access Delays
Nothing stalls momentum faster than waiting.
- Waiting for file permissions
- Waiting for contract approvals
- Waiting for system access
- Waiting for leadership sign-off
This “approval and access chaos” creates stop-and-start work cycles.
Your employees aren’t slow. They’re paused.
- Too Many Tools
Modern businesses in Raleigh and Durham often suffer from tool overload.
Each department adopts its preferred solution:
- Sales uses one CRM
- Marketing uses another automation platform
- Operations uses spreadsheets
- Finance uses a standalone system
Without a standardized tech stack, shadow IT grows.
This creates:
- Data silos
- Security vulnerabilities
- Integration gaps
- Confusion over system ownership
- Inefficient Workflows
Sometimes the issue isn’t technology—it’s process design.
Examples:
- Redundant approval layers
- Unnecessary process steps
- Lack of SOP documentation
- No automation triggers
- Heavy spreadsheet dependency
These common business process bottlenecks increase cognitive load and reduce clarity.
The Cost of Ignoring Hidden Bottlenecks
Ignoring non-people productivity problems creates measurable damage.
Lost Hours Per Week
If each employee loses just 20 minutes per day:
- 100 minutes per week
- 21.6 hours per quarter
- 432 hours annually for a 20-person team
That’s more than 10 weeks of lost output per year.
Revenue Impact
Delays in:
- Quote generation
- Project onboarding
- Billing cycles
Directly impact cash flow.
Employee Frustration & Burnout
High performers thrive in efficient environments.
Persistent friction causes:
- Disengagement
- Workarounds
- Reduced morale
- Turnover risk
Competitive Disadvantage
While your team battles inefficiencies, competitors optimize systems.
Speed compounds.
Signs Your Bottleneck Isn’t Your People
Ask yourself:
- Are high-performing employees still missing deadlines?
- Do you hear frequent “system issues” complaints?
- Are there data inconsistencies across platforms?
- Are employees building manual workarounds?
- Are spreadsheets functioning as “truth databases”?
If yes, you are likely facing operational bottlenecks not people problems.
How to Identify the Real Bottleneck
A structured productivity assessment can reveal hidden friction.
- Conduct Workflow Mapping
Map one major process from start to finish. Identify wait times.
- Audit Software Integrations
Are tools sharing data automatically—or manually?
- Measure Task Completion Time
Time critical workflows.
- Review IT Support Tickets
Recurring complaints highlight friction points.
- Analyze Network Performance
Evaluate bandwidth, latency, device health.
- Evaluate Automation Opportunities
Look for repetitive, rule-based tasks.
This is the foundation of workflow optimization.
How to Fix It
✔ System Integration
Use unified platforms and API integrations to eliminate duplication.
✔ Workflow Automation
Automate approvals and recurring processes.
✔ IT Infrastructure Optimization
Upgrade networks. Refresh hardware. Optimize cloud environments.
✔ Process Standardization
Document SOPs. Consolidate tools. Clarify ownership.
✔ Ongoing IT Monitoring
Proactive support prevents friction from returning.
For many North Carolina organizations, partnering with an MSP provides structured oversight that internal teams may lack.
Case Scenario
A Cary-based professional services firm blamed sales for missed Q1 targets.
Investigation revealed:
- CRM and accounting didn’t sync
- Proposal templates required manual edits
- Approval chains ran through three executives
After integration and workflow automation:
- Proposal turnaround time dropped 22%
- Billing delays decreased
- Q2 revenue improved 18%
No staff changes. No motivational seminars.
Just removal of the bottleneck.
Why Q1 Amplifies Bottlenecks
Q1 introduces:
- Budget deployment
- New initiatives
- Post-holiday workload surges
- Strategic rollouts
Inefficiencies that were tolerable in Q4 become critical in Q1.
Execution speed matters most when momentum is forming.
Leadership Mindset Shift
Here is the shift that transforms organizations:
Stop blaming people.
Start optimizing systems.
Productivity is rarely a character flaw. It is an infrastructure issue.
Technology should remove friction—not create it.
When workflows are aligned, systems integrated, and infrastructure optimized, performance improves naturally.
Your people were never the problem.
Your bottleneck was.
FAQs
- Why does productivity stall in Q1?
Q1 productivity stalls often result from operational friction, disconnected systems, and workflow inefficiencies rather than employee performance issues.
- What are examples of tech friction affecting output?
Slow networks, manual data entry, approval delays, and systems not communicating are common examples.
- How can I remove non-people bottlenecks?
Conduct workflow mapping, audit integrations, upgrade infrastructure, and implement automation.
- How do managed IT services improve productivity?
Managed IT services reduce downtime, optimize systems, streamline integrations, and proactively monitor performance.
- What causes hidden bottlenecks in workflows?
Unnecessary process steps, tool overload, lack of automation, and unclear documentation are frequent causes.